
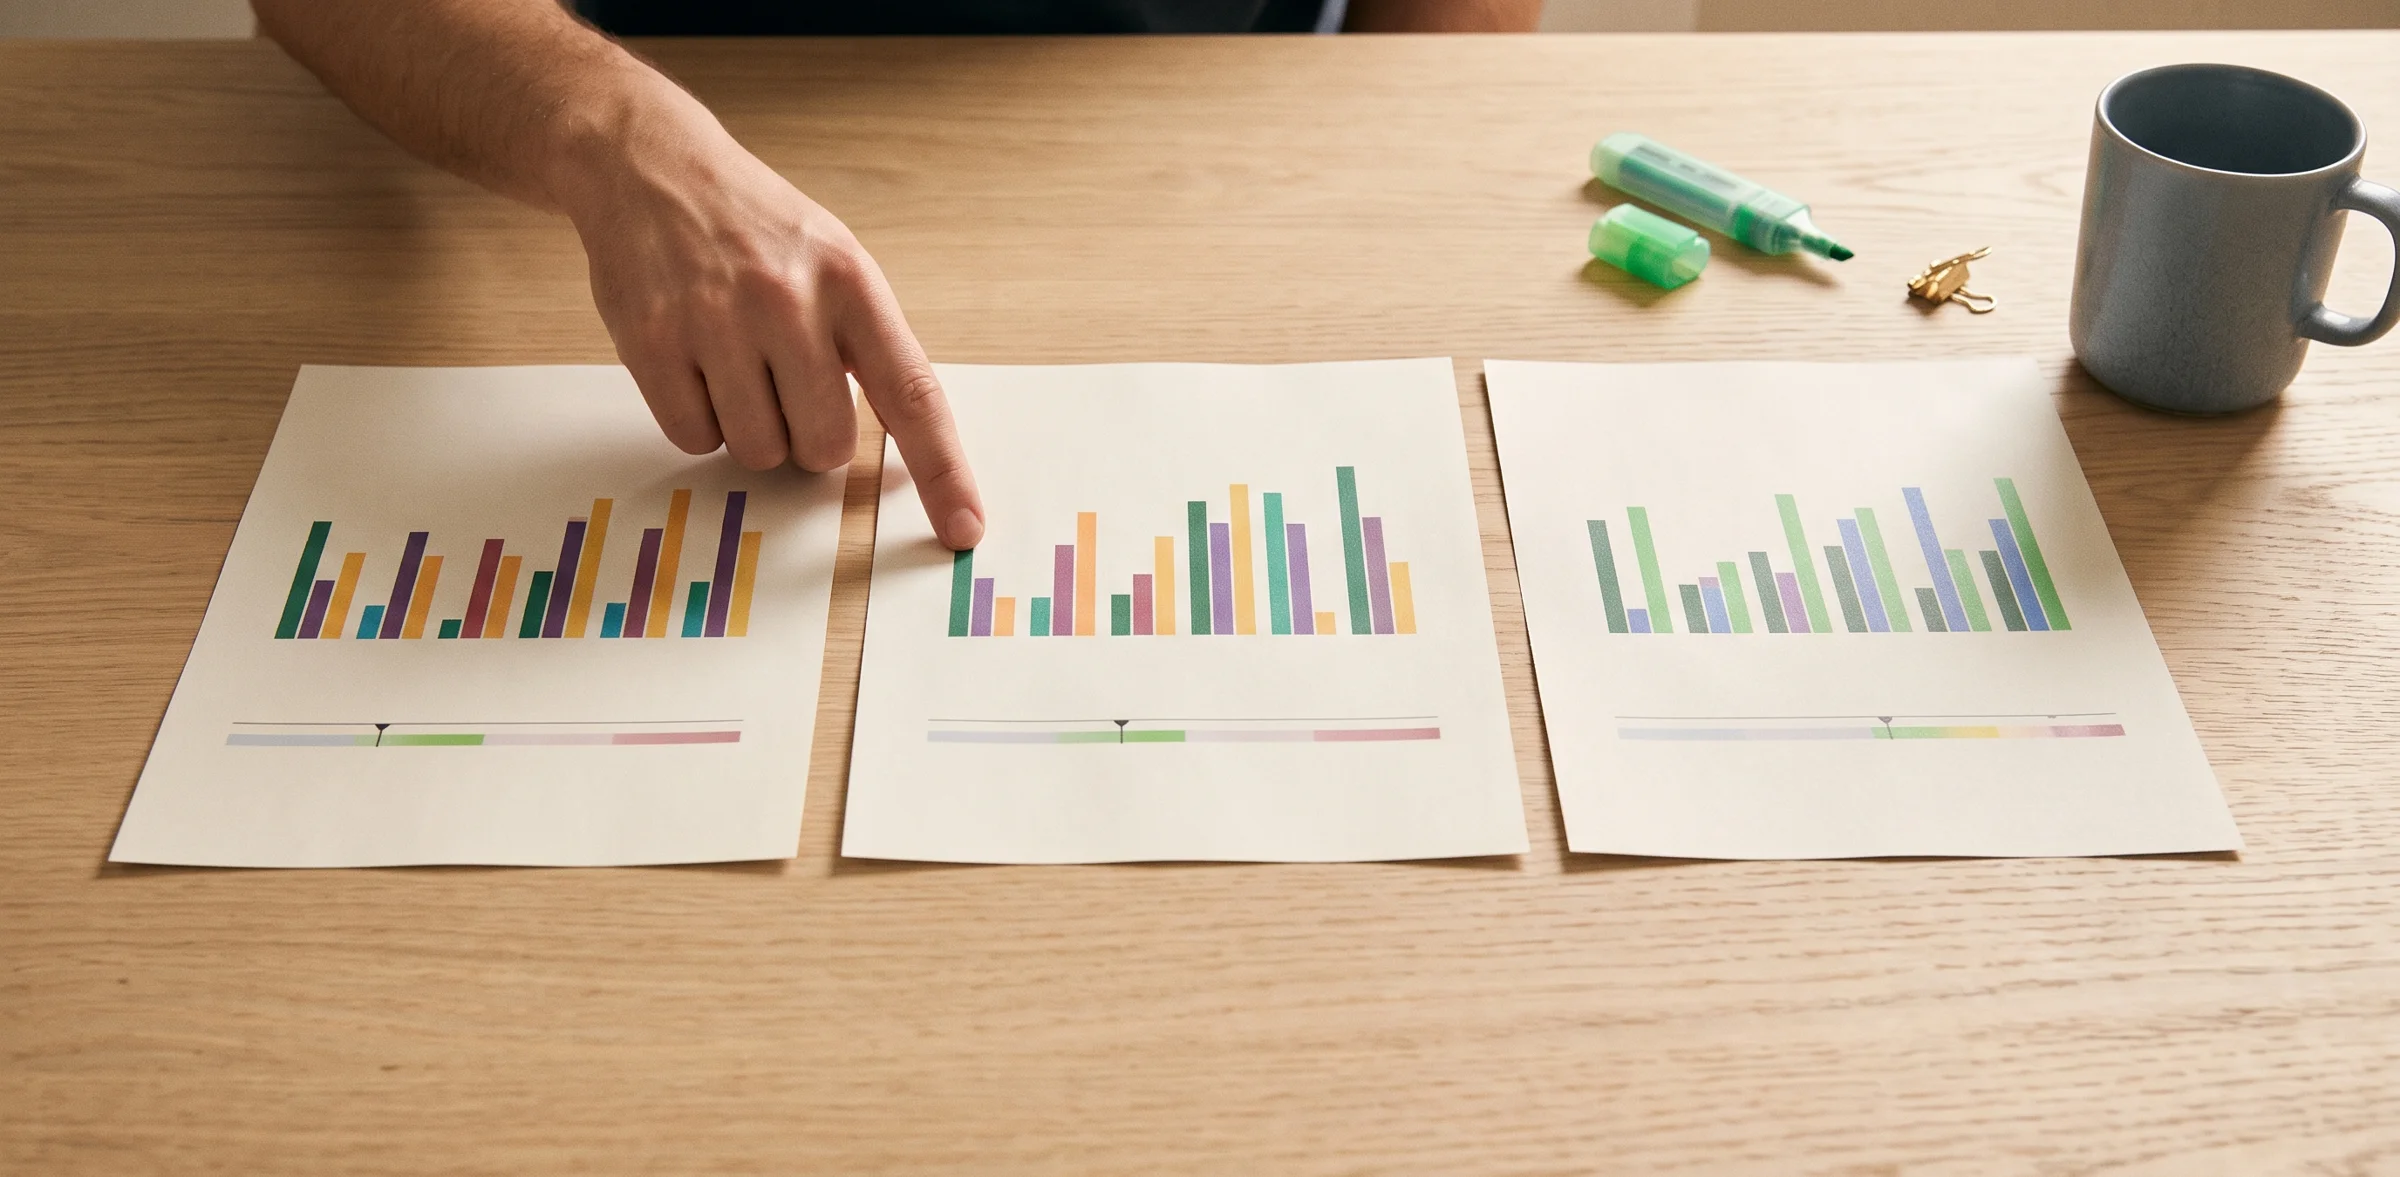
Optimizing the customer journey with Braze data means matching each question to the right report. Canvas analytics shows how every step performs, funnel reports show where users drop out of an ordered sequence, and Experiment Paths compares changes from one shared starting point. This guide explains how the three differ, why their numbers disagree, and the order in which to use them.
Key Takeaways
- Canvas analytics, funnel reports and Experiment Paths each start counting from a different point, so each answers a different question.
- Canvas analytics filters events by when they occurred. Funnel reports filter users by when they entered the Canvas.
- A user converts once per conversion event per Canvas entry, and Braze assigns the conversion to the latest message that user received.
- Conversion events must exist before launch if you want Experiment Paths later, because Braze does not let you add them to a launched Canvas.
- Braze advises placing delays before the Experiment Paths step so that every path starts from the same point.
- We recommend writing the question down before you open any report.
What does optimizing the customer journey with Braze data involve?
CustomerIK is a Braze implementation partner, and the question after launch is simple: is the Canvas working? Braze gives you three places to answer it. Each one counts differently, so each one answers a slightly different question.
The Canvas Details page opens with top-line statistics. Braze lists messages sent, entries, conversions and the conversion rate, revenue and the estimated audience. You can then select a single step and review its metrics on their own.
To hear about a drop without checking, Braze documents Custom Canvas alerts for performance outside an expected range. We recommend deciding the question before you open any report. A dashboard opened without a question tends to produce a number to worry about and no way to act on it.
Which Braze report answers which question?
The table below sets the three views side by side. The starting point and the date filter are the two columns that explain much of the confusion later in this post.
| View | Best question to ask | Where the clock starts | What the date range filters |
|---|---|---|---|
| Canvas Details and Analyze Variants | How is each step or variant performing? | Conversions go to the latest message the user received | Events, by when they occurred |
| Funnel report | Where do users drop out, in order? | When the user receives the message | Users, by when they entered |
| Experiment Paths analytics | Which path or control performs better? | When the user enters the Experiment Paths step | Not documented in the pages we read |
Analyze Variants breaks performance down by variant and control group. It also shows uplift against the control variant and statistical confidence for each conversion event. That makes it the natural place to judge a change you have already made.
How does Braze attribute conversions and revenue in a Canvas?
A user can convert only once per conversion event per Canvas entry. Braze assigns the conversion to the latest message that user received for that entry. If re-eligibility is on and the same user converts on two separate entries, Braze counts two conversions.
Revenue follows a similar rule. Braze tracks it at the Canvas level and attributes it to the latest step and variant the user received a message from, or entered, if no message has arrived yet. Purchases count toward Total Revenue even when the user never performs the primary conversion event, provided the purchase falls inside the attribution rules for the window.
The Show Revenue Breakdown option opens a per-step table. It includes a row for purchases that are not tied to a specific step. Read that row before you credit a step with revenue.
Why do Canvas analytics and funnel reports show different numbers?
They filter on different things. In Canvas analytics, the date range filters events by when they occurred. In a funnel report, the date range filters users by when they entered the Canvas, and then follows them for the completion window you set.
Order matters too. Funnel reports require events in the specified sequence and count each user once only. Canvas analytics count all conversions and engagement with no ordering rule, so step analytics can show higher counts than the funnel for the same dates.
Check one identity detail before you build a funnel around anonymous traffic. Funnel reports only track follow-up events that match the user ID at the time of entry. If a user is identified after entry and their Braze ID changes, later events fall outside the report.
When should you build a funnel report?
Build one when the question is about sequence. Braze describes funnel reports as a way to analyse journeys after a message, including where drop-offs occur. The first event is always the message receipt, and you choose the events that follow.
A user leaves the funnel at the first step where they do not perform the next event in the exact sequence you configured. That is why a short, well-chosen funnel reads better than a long one. Braze says there is no hard limit, and four to six events is enough for the common cases.
The practical limits are documented. The date range can reach back six months, and the completion window has a maximum of 30 days. A one-day window means the event must happen within 24 hours of message receipt, and large queries can time out.
How do Experiment Paths help you test a journey change?
Experiment Paths test multiple Canvas paths against each other and a control group at any point in the user journey. Braze lists delivery, cadence, message copy and channel combinations as the best fits. You can add up to four paths, the percentages must add up to 100%, and the Canvas must already include conversion events.
That last prerequisite is a planning point. Braze notes that you cannot add conversion events once a Canvas has launched, although you can clone the launched Canvas and add them. Decide your conversion events before launch, and the clone is never needed.
The comparison view matters just as much as the split. Experiment Path analytics track conversions from the moment a user enters the Experiment Paths step, and Braze recommends that view for comparing paths because all paths share the same starting point. Individual step analytics start the clock when the user receives that step, so the two views can show different rates for the same path.
What can distort an experiment result?
Delays are the first thing to check. The experiment conversion window, set between 1 and 30 days, starts at the Experiment Paths step and ignores when a downstream message sends. Delay steps and Intelligent Timing inside a path use up part of that window.
Braze gives a worked case. With a 5-day window and a message that Intelligent Timing delays by 2 days, users on that path have 3 days after receiving the message to convert. Braze therefore advises placing delays before the Experiment Paths step.
Editing is the second cause. Updating an active Canvas that has an in-progress Winning Path experiment ends the experiment, even if you do not touch the Experiment Paths step. Paths and their downstream steps cannot be removed once created, so plan the structure before you launch.
Unequal sends are the third. Downstream sends depend on each path's steps, delays, channel eligibility and content, as well as the split. An even split can still produce uneven send counts, so judge paths on Experiment Path analytics rather than on raw sends.
What does a worked example look like?
Take a hypothetical subscription app that wants to shorten the gap between sign-up and first purchase. Its welcome Canvas sends an email and a push message, and the team suspects the second message arrives too late. The Canvas already holds a primary conversion event for first purchase, set before launch.
The team clones nothing, because the conversion event exists. It places the Delay step ahead of an Experiment Paths step. It builds two paths, the current cadence and a version with the second message sent sooner, adds a control group, and leaves the structure alone after launch.
When results arrive, the team reads Experiment Path analytics first, because both paths share a starting point. It then checks the revenue breakdown for unattributed purchases. Last, it builds a funnel report to see where users drop between the first email and the first purchase.
No figures appear here on purpose, because the example shows the order of work. The Braze pages we read give no benchmark for a good conversion rate, uplift or drop-off, so this post gives none.
What order should you follow?
The sequence below is our own suggestion, and Braze does not prescribe it.
- Write the question down, and name the conversion events before the Canvas launches.
- Put any delays ahead of the Experiment Paths step.
- Read Experiment Path analytics for the comparison and Analyze Variants for uplift and confidence.
- Use the revenue breakdown to see which purchases are not tied to a step.
- Build a funnel report only when the question is about order and drop-off.
- Change one thing at a time, and avoid editing the active Canvas mid-experiment.
How does this connect to the rest of the programme?
Journey measurement sits on top of clean event data, so start with tracking user events in Braze. The structure of the Canvas matters just as much, which is covered in automating complex workflows in Braze Canvas.
If your goal is early activation, see measuring onboarding success in Braze. For the long view, read retention metrics to track in Braze. Channel-level testing is covered in email A/B testing in Braze, and journeys that need outside reporting are covered in connecting Braze with external analytics platforms.
If your questions go beyond the native reports, CustomerIK's marketing analytics service covers dashboards and attribution modelling.
As a Braze implementation partner, we recommend choosing one journey, naming one question and one conversion event, and running a single Experiment Paths test before widening the programme. The Braze documentation sets the mechanics, and a narrow first test shows whether your measurement can be trusted.
Frequently Asked Questions
1. Why do my Canvas conversions and funnel conversions not match?
Canvas analytics filter events by when they happened and count conversions without an ordering rule. Funnel reports filter users by entry date, require the events in order, and count each user once only.
2. Can I add a conversion event after launching a Canvas?
Braze says you cannot add conversion events after a Canvas has launched. You can clone the launched Canvas, add the events, and then add Experiment Paths.
3. How many events should a funnel report include?
Braze says there is no hard limit, and four to six events is enough for the common cases. Large queries can time out, so Braze suggests a shorter report window or fewer funnel steps.
4. Why do sends differ across paths when the split looks even?
Downstream sends depend on each path's steps, delays, channel eligibility and content. Use Experiment Path analytics to compare outcomes from a common entry point.
5. Where should delays go in an experiment?
Braze advises placing delays such as Delay steps before the Experiment Paths step. That way every path starts from the same point and the delays do not use up the conversion window.
Sources
- Braze, Canvas Analytics. Retrieved 27 Oct 2026.
- Braze, Funnel Reports for campaigns and Canvases. Retrieved 27 Oct 2026.
- Braze, Experiment Paths. Retrieved 27 Oct 2026.
- This post rests on three Braze documentation pages, and Braze documentation is the source of truth for current behaviour.
- Written by CustomerIK, a Braze implementation partner.
CustomerIK is a Braze implementation partner working across onboarding, technical integration, marketing operations and customer data management.
If you want a second pair of eyes on how your Canvases are measured, let's talk.